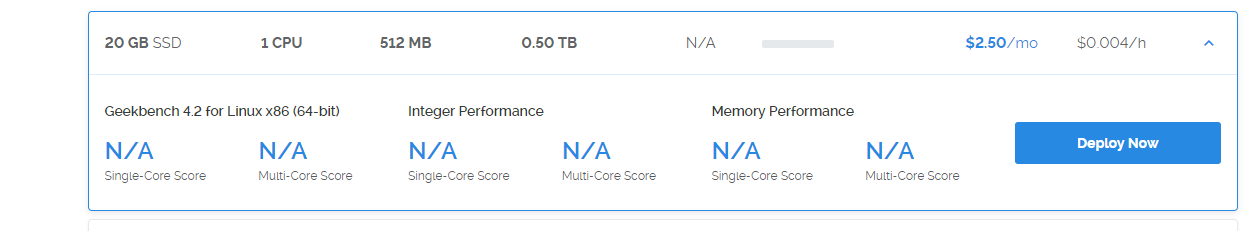
同事介绍这个服务器提供商,是按小时计费,不限带宽,遇到IP被墙,即时可换IP的服务。
https://www.vultr.com
分类目录归档:未分类
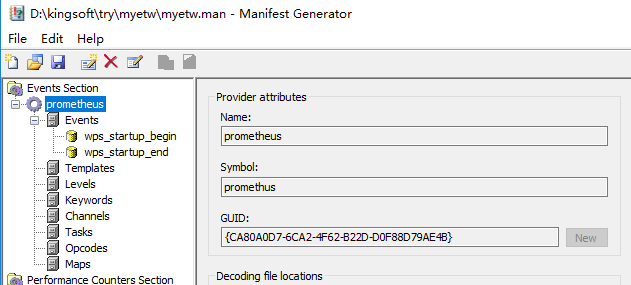
etw的信息提取
https://docs.microsoft.com/en-us/windows-hardware/test/wpt/xperf-actions
xperf -tle –i myetw.etl -o providers.csv -a dumper -provider {CA80A0D7-6CA2-4F62-B22D-D0F88D79AE4B}
https://docs.microsoft.com/en-us/windows-hardware/test/weg/instrumenting-your-code-with-etw
Copy your component to the location that was specified in your manifest by the resourceFileName attribute:

xcopy /y MyProviderBinary.exe %temp%

Register the providers:

wevtutil um etwmanifest.man
wetvutil im etwmanifest.man

Verify that the provider is visible:

logman query providers

Your provider name/GUID will appear in the list.
1.Start tracing:
  xperf -start MySession -on MyEventProvider -f MySession.etl
  # In that command line, -start gives the event collection session a name, and -on tells ETW that you want to collect events from your provider in this session. (There can be multiple -on arguments.)
2.Execute your workload.
3.Stop tracing:
  xperf -stop MySession
@echo off
echo "clean session.."
xperf -stop app_session -d app_tmp.etl
xperf -stop -d base_tmp.etl
if exist app_tmp.etl (del app_tmp.etl)
if exist base_tmp.etl (del base_tmp.etl)

echo "open session.."
set now=%date:~0,4%%date:~5,2%%date:~8,2%_%time:~0,2%%time:~3,2%%time:~6,2%
set now=%now: =0%
echo %now%
xperf -start -on Base
xperf -start app_session -on CA80A0D7-6CA2-4F62-B22D-D0F88D79AE4B

echo "请启动prometheus应用。"

timeout 100

xperf -stop app_session -d  app_tmp.etl
xperf -stop -d base_tmp.etl
xperf -merge base_tmp.etl app_tmp.etl prometheus_%now%.etl

xperf -tle -i abc_%now%.etl -o hardfaults_%now%.csv -a hardfault -file -bytes
xperf -tle -i abc_%now%.etl -o time_%now%.csv -a dumper -provider {CA80A0D7-6CA2-4F62-B22D-D0F88D79AE4B}
xperf -tle -i abc_%now%.etl -o pagefaults_%now%.csv -a dumper -provider {3D6FA8D3-FE05-11D0-9DDA-00C04FD7BA7C}
rem start wpa.exe abc_%now%.etl
docker 网络host模式
docker run -d --net="host" --name webrtc-waypal-build-heguowen -v /root/webrtc_waypal:/webrtc_waypal -it webrtc-waypal-heguowen:v1 /bin/bash
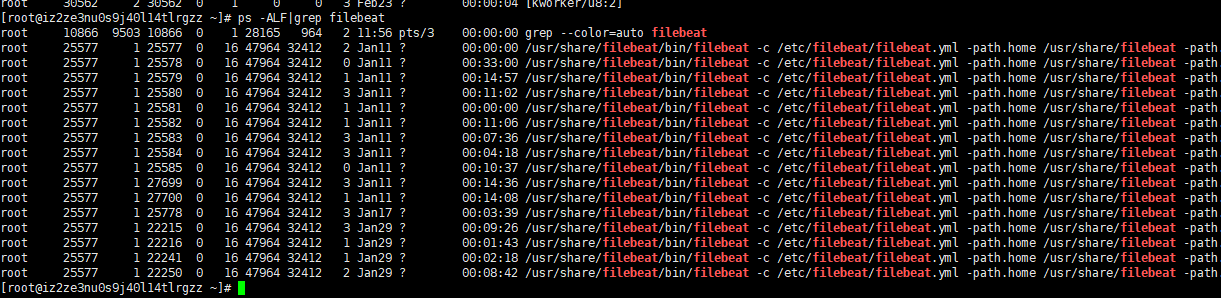
常用的Linux维护命令
1.ps -ALF
2.
线程安全队列
LinkedBlockingQueue
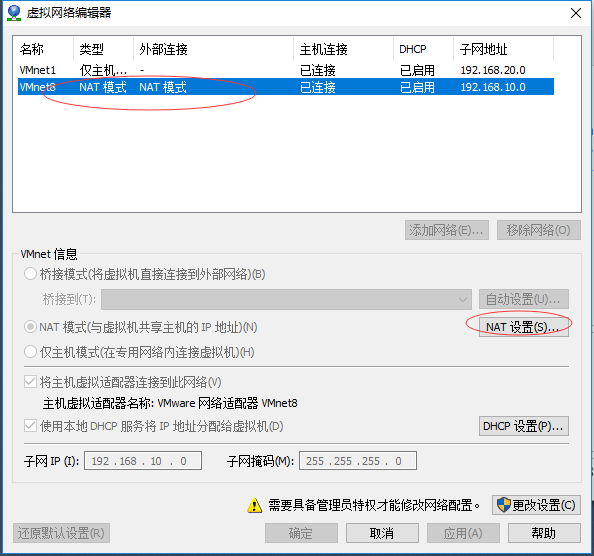
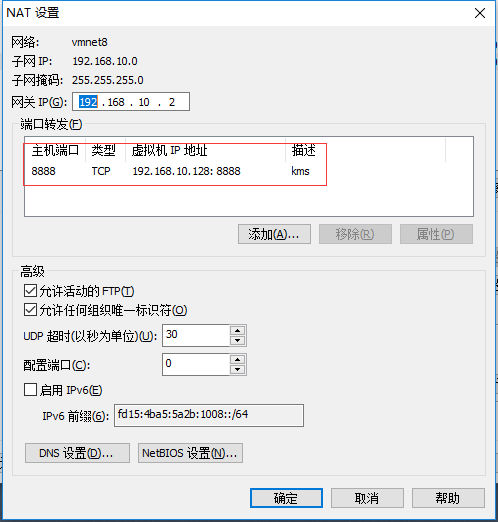
VMWare端口映射
在进行kms的例子测试时,发现快速试验kurento的最佳方式就是【kurento-tutorial-java】+【kurento/kurento-media-server】,然而笔记本摄像头在linux中不被支持,故通过VMware把linux中的kms端口映射到主机中。
PHP的伪注解:@var
/* @var $apiService MapiService */请注意:@var前是需要空格隔开的。
$apiService = Factory::create ( 'MapiService' );
$orderInfo = $apiService->getOrderInfo($orderSn);
ELK中文文档教程
ELK中文文档教程
https://kibana.logstash.es/content/
指定JDK的编译版本
eclipse-4.6.2版本,默认JDK的编译版本是1.8,故在编译目标平台为JDK1.7.x的时候,需要修改其编译版本,否则在导入工程时,会导致导入后的工程默认JAVA编译版本为1.8。
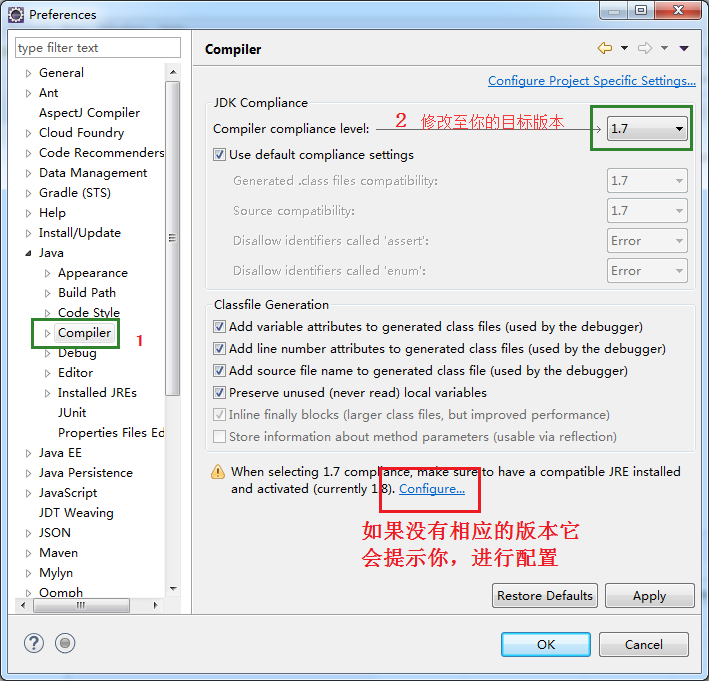
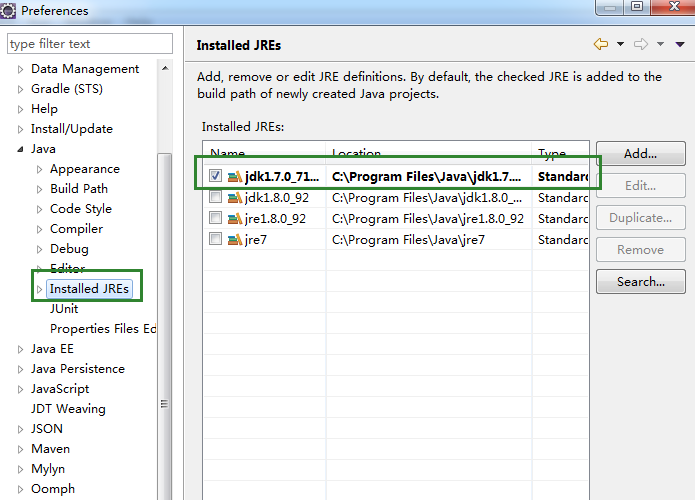
此外,仍然要添加1.7.x的已经安装版本。如下图
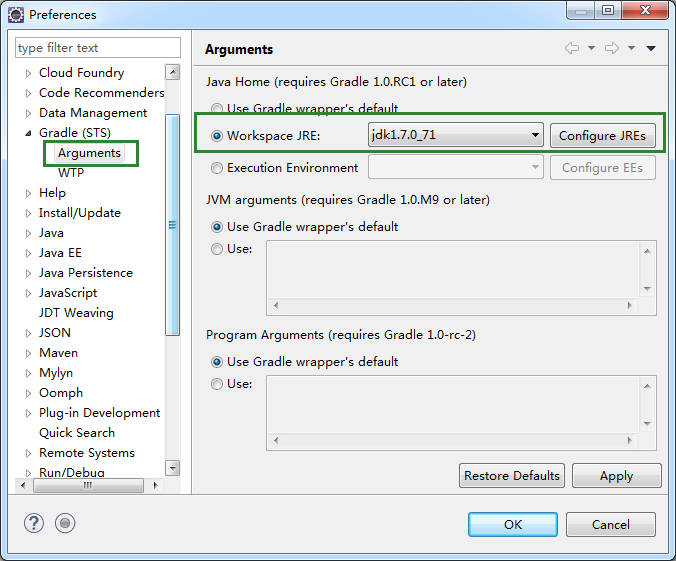
至此,仍有一些特殊,如使用Gradle,也需要同步修改导入的JDK版本,才能正常编译与调试,否则会出错,如下图。

按道理应该是可以在build.gradle中指定编译版本,但发现网上说的方法,均在导入项目过程中报脚本属性错误,估计网上的方法是适用于Android版本。
形如:
sourceCompatibility = "1.6"
targetCompatibility = "1.6"
安装Elasticsearch&Kibana&X-Pack
1.下载文件:
https://artifacts.elastic.co/downloads/elasticsearch/elasticsearch-5.2.0.tar.gz
https://artifacts.elastic.co/downloads/kibana/kibana-5.2.0-linux-x86_64.tar.gz
https://artifacts.elastic.co/downloads/logstash/logstash-5.2.0.tar.gz
https://artifacts.elastic.co/downloads/packs/x-pack/x-pack-5.2.0.zip
https://artifacts.elastic.co/downloads/beats/heartbeat/heartbeat-5.2.0-linux-x86_64.tar.gz
https://artifacts.elastic.co/downloads/beats/filebeat/filebeat-5.2.0-linux-x86_64.tar.gz
https://artifacts.elastic.co/downloads/beats/packetbeat/packetbeat-5.2.0-linux-x86_64.tar.gz
2.分别解压elasticsearch\kibana\logstash后,各自执行以下命令安装xpack。
bin/elasticsearch-plugin install file:///path/to/file/x-pack-5.2.0.zip
bin/kibana-plugin install file:///path/to/file/x-pack-5.2.0.zip
bin/logstash-plugin install file:///path/to/file/x-pack-5.2.0.zip
卸载命令
bin/elasticsearch-plugin remove x-pack
bin/kibana-plugin remove x-pack
bin/logstash-plugin remove x-pack
3.启动相应应用
bin/elasticsearch
bin/kibana
bin/logstash
4.登录相关后台
----------------------------
kibana的后台:
http://localhost:5601
帐号与密码
Username: elastic Password: changeme
------------------------------
elasticsearch的restfullAPI
http://localhost:9200
-----------------------
logstash的后台
参考文档:
https://www.elastic.co/start
https://www.elastic.co/guide/en/x-pack/current/xpack-introduction.html
https://www.elastic.co/guide/en/x-pack/current/installing-xpack.html